In November 2023, we announced Amazon CloudWatch Application Signals, an AWS built-in application performance monitoring (APM) solution, to solve the complexity associated with monitoring performance of distributed systems for applications hosted on Amazon EKS, Amazon ECS, and Amazon EC2. Application Signals automatically correlates telemetry across metrics, traces, and logs, to speed up troubleshooting and reduce application disruption. By providing an integrated experience for analyzing performance in the context of your applications, Application Signals gives you improved productivity focusing on the applications that support your most critical business functions.
Today we’re announcing the availability of Application Signals for AWS Lambda to eliminate the complexities of manual setup and performance issues required to assess application health for Lambda functions. With CloudWatch Application Signals for Lambda, you can now collect application golden metrics (the incoming and outgoing volume of requests, latency, faults, and errors).
AWS Lambda abstracts away the complexity of the underlying infrastructure, enabling you to focus on building your application without having to monitor server health. This allows you to shift your focus toward monitoring the performance and health of your applications, which is necessary to operate your applications at peak performance and availability. This requires deep visibility into performance insights such as volume of transactions, latency spikes, availability drops, and errors for your critical business operations and application programming interfaces (APIs).
Previously, you had to spend significant time correlating disjointed logs, metrics, and traces across multiple tools to establish the root cause of anomalies, increasing mean time to recovery (MTTR) and operational costs. Additionally, building your own APM solutions with custom code or manual instrumentation using open source (OSS) libraries was time-consuming, complex, operationally expensive, and often resulted in increased cold start times and deployment challenges when managing large fleets of Lambda functions. Now, you can use Application Signals to seamlessly monitor and troubleshoot health and performance issues in serverless applications, without requiring any manual instrumentation or code changes from your application developers.
How it works
Using the pre-built, standardized dashboards of Application Signals, you can identify the root cause of performance anomalies in just a few clicks by drilling down into performance metrics for critical business operations and APIs. This helps you visualize application topology which shows interactions between the function and its dependencies. In addition, you can define Service Level Objectives (SLOs) on your applications to monitor specific operations that matter most to you. An example of an SLO could be to set a goal that a webpage should render within 2000 ms 99.9 percent of the time in a rolling 28-day interval.
Application Signals auto-instruments your Lambda function using enhanced AWS Distro for OpenTelemetry (ADOT) libraries. This delivers better performance such as lower cold start latency,
memory consumption, and function invocation duration, so you can quickly monitor your applications.
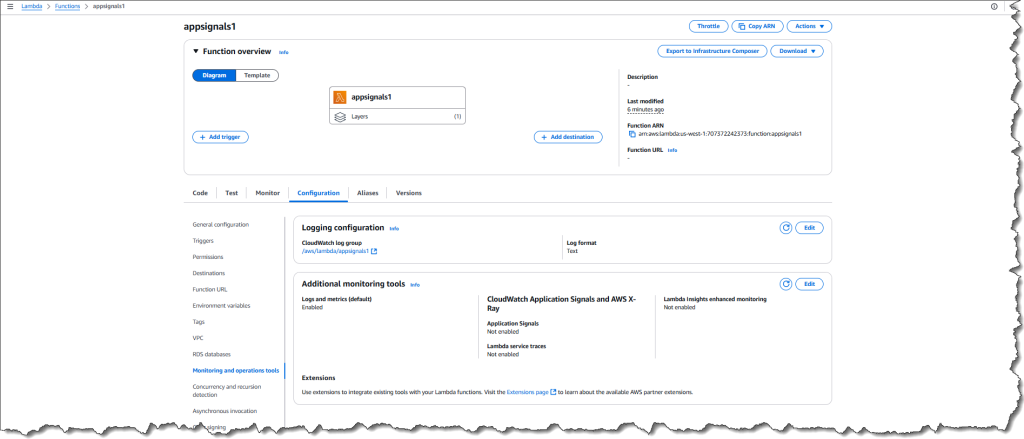
I have an existing Lambda function appsignals1 and I will configure Application Signals in the Lambda Console to collect various telemetry on this application.
In the Configuration tab of the function I select Monitoring and operations tools to enable both the Application signals and the Lambda service traces.
I have an application myAppSignalsApp that has this Lambda function attached as a resource. I’ve defined an SLO for my application to monitor specific operations that matter most to me. I’ve defined a goal that states that the application executes within 10 ms 99.9 percent of the time in a rolling 1-day interval.
It can take 5-10 minutes for Application Signals to discover the function after it’s been invoked. As a result you’ll need to refresh the Services page before you can see the service.
Now I’m in the Services page and I can see a list of all my Lambda functions that have been discovered by Application Signals. Any telemetry that is emitted will be displayed here.
I can then visualize the complete application topology from the Service Map and quickly spot anomalies across my service’s individual operations and dependencies, using the newly collected metrics of volume of requests, latency, faults, and errors. To troubleshoot, I can click into any point in time for any application metric graph to discover correlated traces and logs related to that metric, to quickly identify if issues impacting end users are isolated to an individual task or deployment.
Available now
Amazon CloudWatch Application Signals for Lambda is now generally available and you can start using it today in all AWS Regions where Lambda and Application Signals are available. Today, Application Signals is available for Lambda functions that use Python and Node.js managed runtimes. We’ll continue to add support for other Lambda runtimes in near future.
To learn more, visit the AWS Lambda developer guide and Application Signals developer guide. You can submit your questions to AWS re:Post for Amazon CloudWatch, or through your usual AWS Support contacts.
– Veliswa.


